Data Visualization in Google Sheets
Learn the fundamentals of data visualization using Google Sheets.
A picture can tell a thousand words – but only if you use the right picture! This course teaches you the fundamentals of data visualization with Google Sheets.
Chart Creation Techniques
In this course, you’ll start by learning how to create various common chart types, including bar charts, histograms, and scatter charts. You’ll not only master these basic chart types but also delve into more advanced options such as sparkline and candlestick charts. These tools are essential for effective data presentation, allowing you to convey complex information in an easily digestible visual format. Whether you’re analyzing sales data, survey results, or any other kind of numerical data, these charting techniques will be invaluable.
Data Management and Analysis
Data preparation is key in data visualization. This course guides you through the use of Data Validation and VLookup formulas to precisely target specific data for charting. You’ll learn how to organize and sift through your data to find the insights you need. Additionally, the course covers the use of Conditional Formatting, a powerful tool in Google Sheets that enables you to apply formats to cells or ranges based on certain criteria. This skill is particularly useful for highlighting key data points, identifying trends, and making your data more readable and impactful.
Dashboard Creation and Real-world Applications
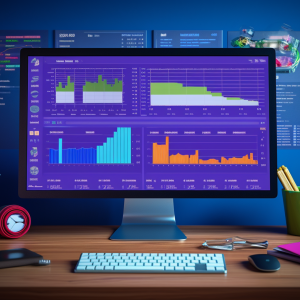
The final part of the course focuses on creating a comprehensive dashboard that combines plots and data. Dashboards are essential for summarizing complex data sets and providing an at-a-glance view of key metrics. You’ll apply the skills you’ve learned by using real-world data sets, such as information from the Olympics, shark attack records, and Marine Technology data from the ASX. This hands-on approach ensures that by the end of the course, you’ll not only understand the theory behind data visualization but also have practical experience in applying these techniques in real-world scenarios.


There are no reviews yet.