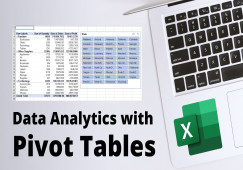
Data Analytics with Excel Pivot Tables
Learn data analytics with helpful Pivot Tables in Excel. Find data insights and start analyzing the data to get better results.
Data Analytics
Data Analytics is one of the most important aspect in every business in this 21st Century. Nowadays businesses are flooded with lots of data. The main role of Data Analyst is to find relevant information which can be useful in making some important decisions in the business.
Why Pivot Tables?
Pivot Tables is one of the essential tool available in MS Excel, with which you can perform many tasks. It let’s you summarize the data and you can use various operations to find important insights.
In this course…
You will be able to learn all the basic fundamentals of Pivot Tables for analytics. you will learn how to
Create a Pivot Table
Prepare CrossTabs
Apply Filters
Use Slicers
Use Date Timelines
Apply Value Calculations
So build your basics strong and start your journey to become a Data Analyst. Enroll in this course now!!!
–
SKILLS YOU WILL GAIN
Data Analytics
Excel for Analysis
WHAT YOU WILL LEARN
Pivot Tables
Data Insights
User Reviews
Be the first to review “Data Analytics with Excel Pivot Tables”
Original price was: ₹996.00.₹249.00Current price is: ₹249.00.
There are no reviews yet.