This course was funded by a wildly successful Kickstarter.
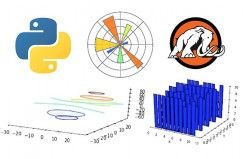
Do you want to learn how to visualize data? Enroll in this course to learn how to do so directly in code. This course is suitable for coding beginners because we begin with a complete introduction to coding. Then we delve deep into using Matplotlib, a Python 2D plotting library.
In Part 1, you learn how to use Python, a popular coding language used for websites like YouTube and Instagram. You learn the basics of programming, including topics like variables, functions, and if statements. You learn about data structures such as lists, dictionaries, and sets. We cover how to use for and while loops, how to handle user input and output, file input and output.
We apply our knowledge to build a fully functional tic-tac-toe game. You learn classes, methods, attributes, instancing, and class inheritance. We make an additional Blackjack game! You learn how to solve errors that can occur when you work as a programmer.
In Part 2, you take your Python knowledge and apply it to Matplotlib. We go over many cool features of Matplotlib that we can use for data visualization. We show you how to make line plots, scatter plots, candlestick plots. You learn how to customize the visuals of your graph and to add text and annotate graphs. And much more!


There are no reviews yet.