Showing 10081–10092 of 18767 results

Introduction to Serverless Architectures on AWS
A serverless architecture provides a new model for building applications in the cloud that provides multiple advantages. This course will teach you the basics of a serverless approach and prepare you for serverless development in this learning path.
Introduction to Shell
The Unix command line helps users combine existing programs in new ways, automate repetitive tasks, and run programs on clusters and clouds.

Introduction to Ships, Ports and Terminals
This Free Online Course Includes: 4-5 Hours of Learning CPD Accreditation Final Assessment

Introduction to Site Reliability Engineering (SRE)
Organizations large and small have started to realize just how crucial system and application reliability is to their business. They have also learned the difficulty of maintaining that reliability while iterating at the speed demanded by the marketplace. Site Reliability Engineering (SRE) is a proven approach to this challenge.

Introduction to Software Project Management
This Free Online Course Includes: 10-15 Hours of Learning CPD Accreditation Final Assessment

Introduction to Software Project Management
This Free Online Course Includes: 10-15 Hours of Learning CPD Accreditation Final Assessment

Introduction to Software Quality Management
This Free Online Course Includes: 10-15 Hours of Learning CPD Accreditation Final Assessment
Introduction to software testing concepts
Describe the common best practices, theory, and patterns of writing tests. Characterize the types of problems that testing can solve for your repository.
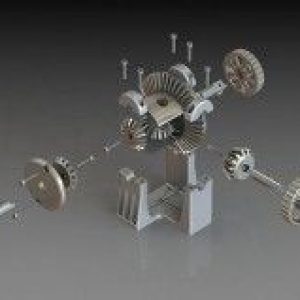
Introduction to SOLIDWORKS 2018
Learn SOLIDWORKS 2018 which is used by well known industries because it helps in designing and build any parts, drawings and assemblies with ease.
Introduction to Spark SQL in Python
Learn how to manipulate data and create machine learning feature sets in Spark using SQL in Python.
Introduction to Spark with sparklyr in R
Learn how to run big data analysis using Spark and the sparklyr package in R, and explore Spark MLIb in just 4 hours.

Introduction to SpriteKit : Build practical games
In this iOS Spritekit tutorial, you will learn how to use Spritekit to build practical 2D games for iOS in Xcode and Swift from scratch.